How to Use Debugging Tools To Analyse .DMP Files?
Reader Question:
“Hi Wally, How do I fix this Blue Screen Error. I’ve done everything, but I still keep getting this error. Is there a way to fix this from .dmp files?” – Many Users
Before addressing any computer issue, I always recommend scanning and repairing any underlying problems affecting your PC health and performance:
- Step 1 : Download PC Repair & Optimizer Tool (WinThruster for Win 10, 8, 7, Vista, XP and 2000 – Microsoft Gold Certified).
- Step 2 : Click “Start Scan” to find Windows registry issues that could be causing PC problems.
- Step 3 : Click “Repair All” to fix all issues.
Setting up weekly (or daily) automatic scans will help prevent system problems and keep your PC running fast and trouble-free.
Wally’s Answer: In this article, we will be looking at how to use WinDbg to read and understand the information in .dmp files. A few simple and important pieces of information can help you locate the Blue Screen error’s cause.
Note: If you want to know where Blue Screen Dump files are located, and how to get someone else to analyze them for your, then click here
If you want to know how to Download and Install the WinDbg tool, then click here
If you want to know how to run WinDbg and open a Crash Dump file (.dmp) in it, then click here
Use WinDbg Commands
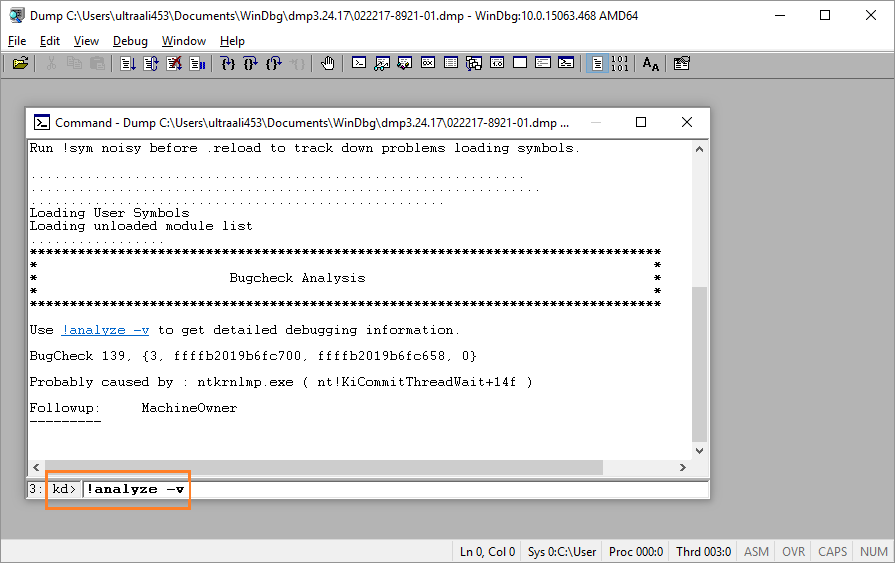
Now that you have the .dmp file opened in WinDbg, you can use some commands to find the problem. Click the !analyze -v link as shown in the picture below.
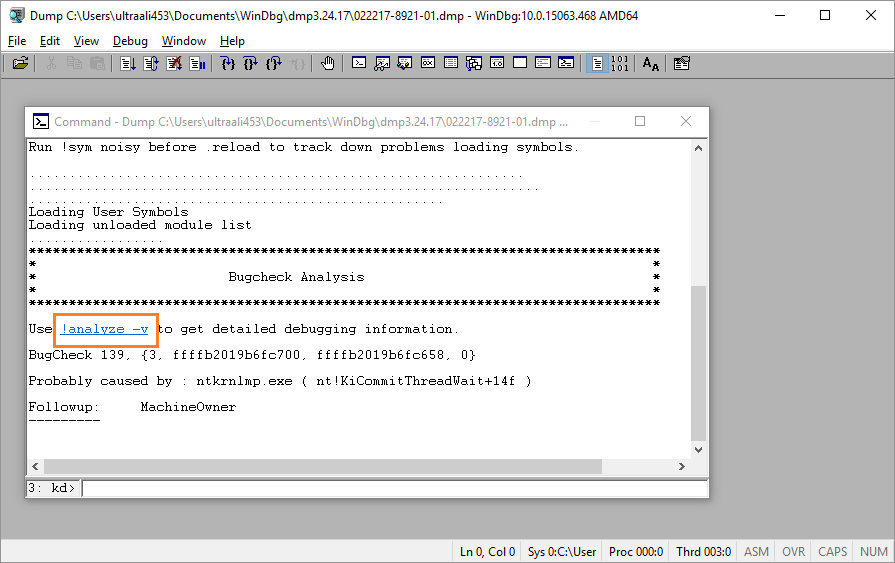
This command will reveal a lot of information about the error.
When you want to exit WinDbg, click the Debug menu and click Stop Debugging
After that, close the window. If you try to close it directly, then it might stop responding.
How To Read The Error Information After Using The !analyze -v Command?
After triggering the !analyze -v command by clicking its link. You can also type it in manually in the command area.
You can see where the Blue Screen error name is located in this analysis.
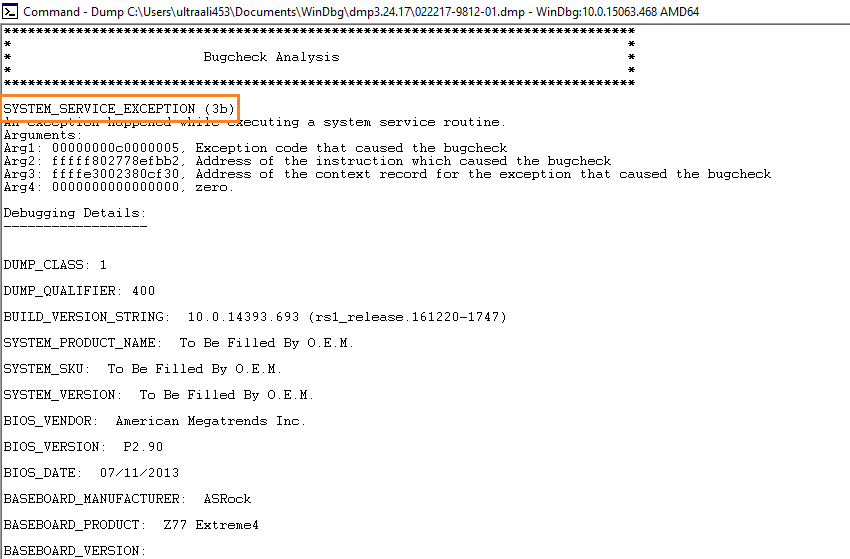
Other information is also visible as follows
Using Commands In WinDbg
You can use commands by typing them in the command bar and pressing Enter.
Click the command bar, and type the command. Here are two particularly useful commands.
!analyze -v
.hh
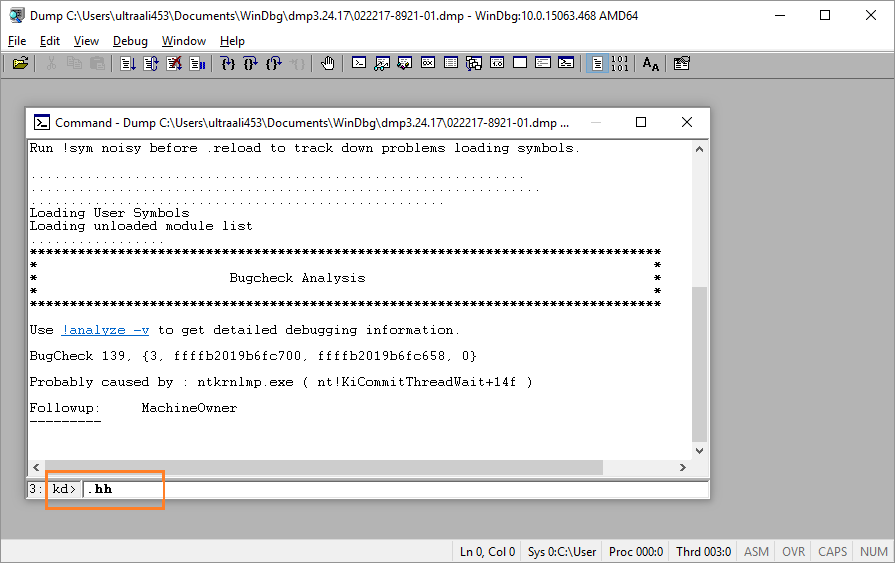
The first one has been explained above. While the .hh command is explained below
Use The .hh Help Command To See What Error Codes Mean
You can type and execute the command .hh to open the help dialog. This help dialog contains all error codes. Once it opens, click Index and type bug check followed by the bug code you identified.
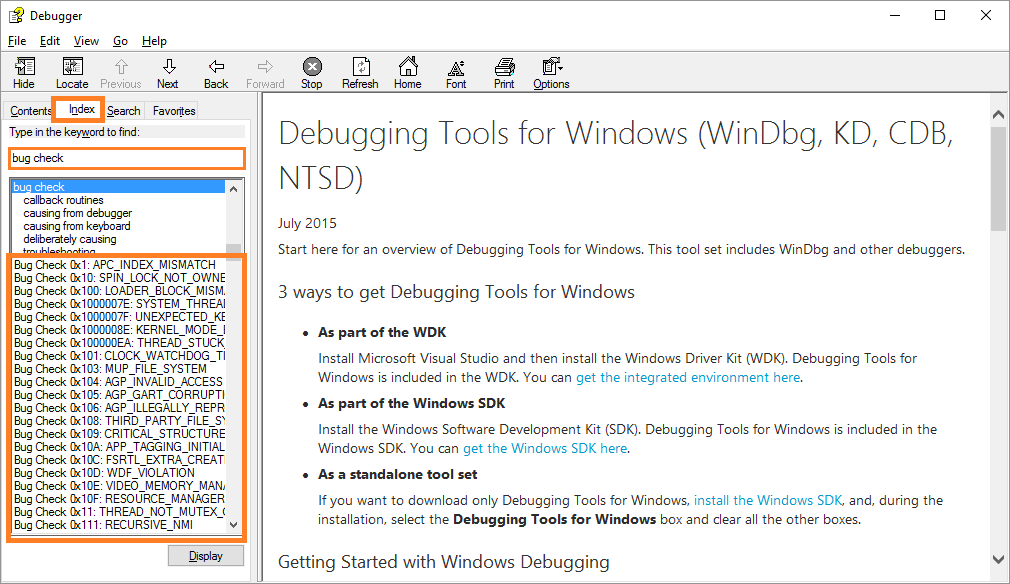
Simply writing bug check will show all bug codes (blue screen error codes)
Writing bug check followed by the error code will bring up specific results. Click the matching search result and read further detail on the right-hand side.
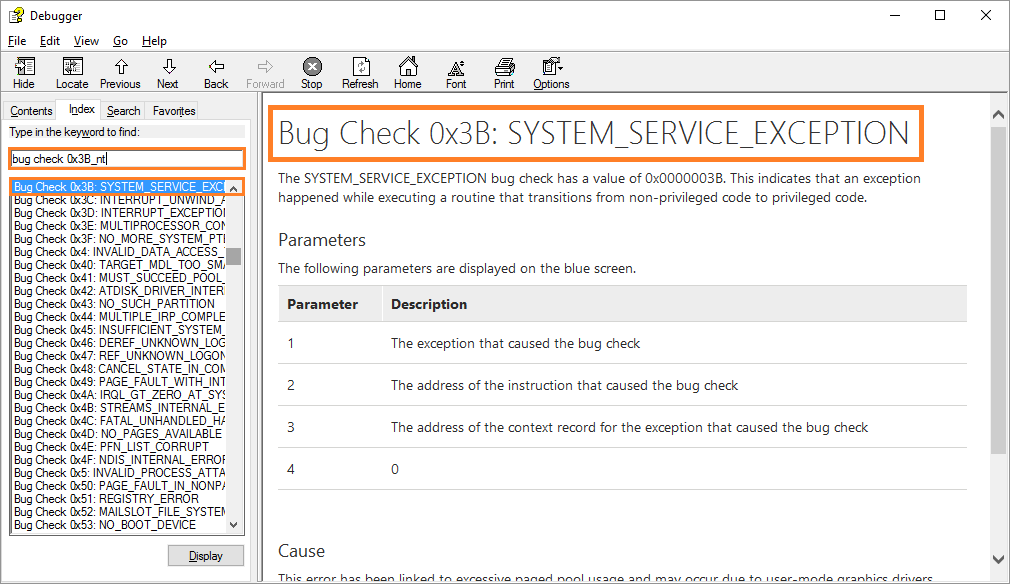
What Software and File Caused This Error?
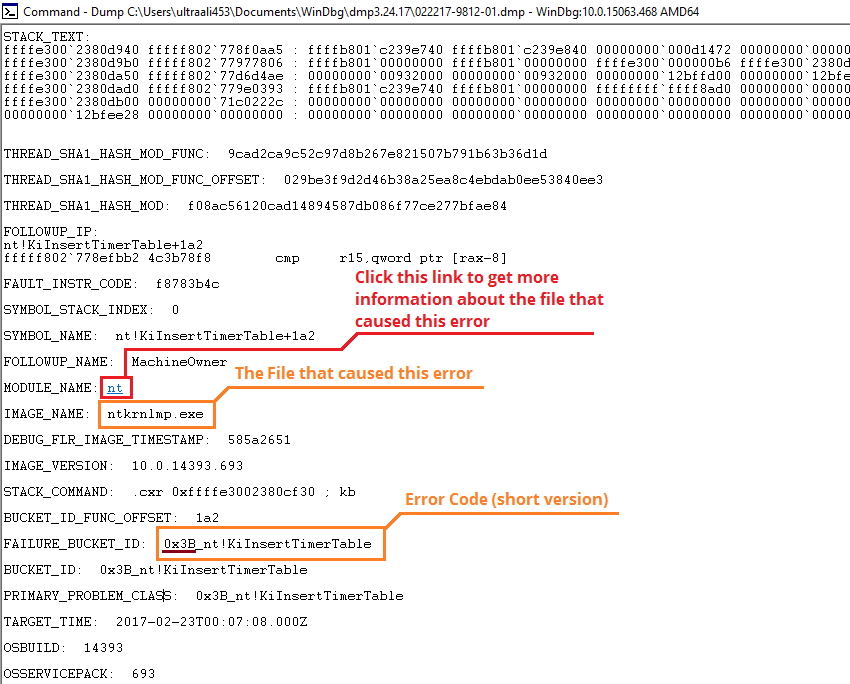
You can find out which Software Program and Specific File caused this error by clicking the link in front of MODULE_NAME as shown below in Red.
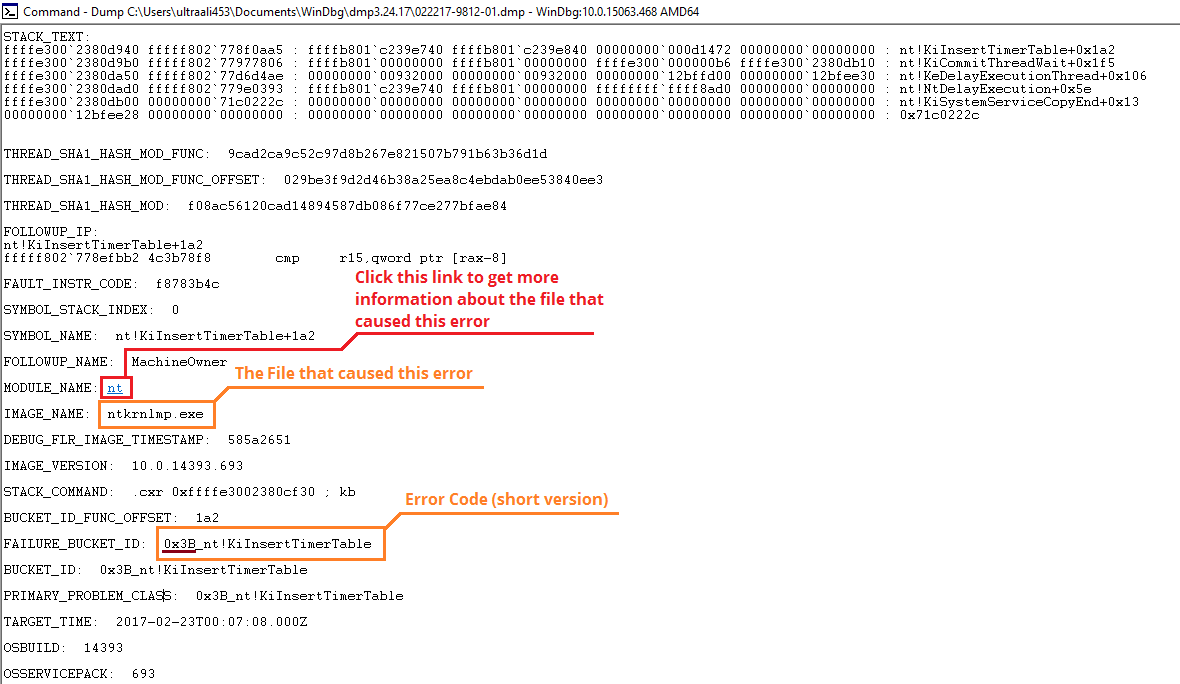
Here, Error Code (short Version) implies to the underlined text 0x3B
You can also get this information by scrolling to the end of the analysis.
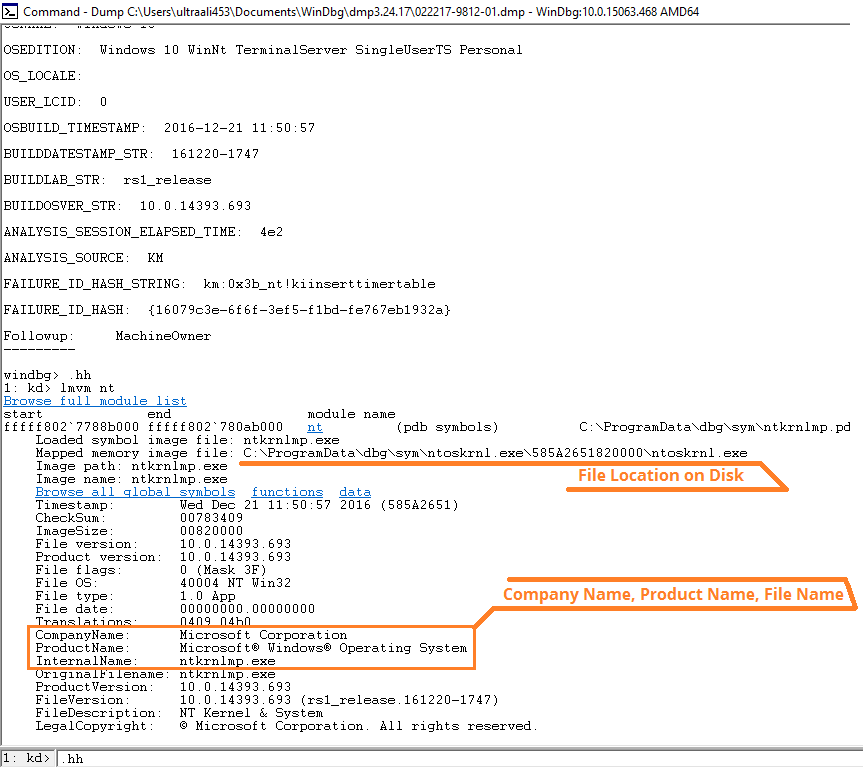
Here, you can see the Company’s Name who made this software; the Name of the Program that caused this problem, and the Name of the File that triggered this error.
In this article, we learned how to analyze .dmp files. Now, we’re going to look at a few proven ways to deal with Blue Screen errors after we have identified them click here
I Hope You Liked This Blog Article! If You Need Additional Support on This Issue Then Please Don’t Hesitate To Contact Me On Facebook.
Is Your PC Healthy?
I always recommend to my readers to regularly use a trusted registry cleaner and optimizer such as WinThruster or CCleaner. Many problems that you encounter can be attributed to a corrupt and bloated registry.
Happy Computing! ![]()

Wally's Answer Rating
Summary: Every Windows Wally blog post is evaluated on these three criteria. The average of all three elements determines an "Overall Rating" for each blog post.

